Debugging Distributed Systems
In distributed systems, symptoms appear far from causes and clocks disagree about what happened first. Learn a debugging method, which tool answers which question, the usual culprits, and why logical clocks are needed to reason about causality.
🎯 What you'll learn
- Why distributed debugging is different
- A method: scope, timeline, hypothesis, verify
- Tools: traces, logs, metrics, profiles and what each answers
- Common culprits, bug patterns, and clocks vs causality
📚 Before you start
1Why It's Different
In a single process you can set a breakpoint, step through, and see the whole state. In a distributed system:
- the "program" spans many processes, machines and teams;
- failures are partial (some instances, some regions, some requests);
- timing matters — bugs depend on interleavings, latency, retries, clock skew;
- you usually can't reproduce production conditions locally;
- the act of observing (adding logs, attaching debuggers) can change timing.
So debugging becomes investigation from telemetry, guided by hypotheses — closer to science than to stepping through code.
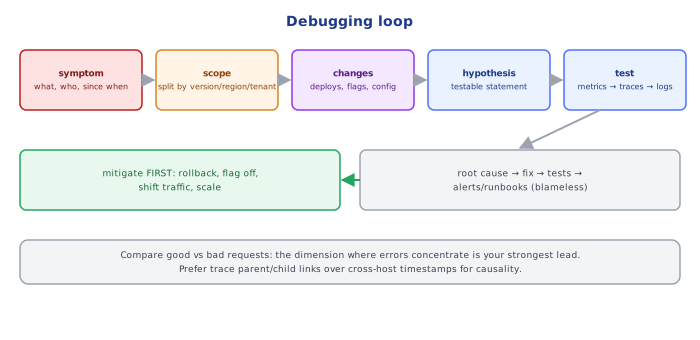
2A Method
1. define the symptom precisely   what fails? for whom? since when? how much? (error rate, latency, affected %)
2. scope it                        which endpoints/regions/versions/tenants/instances? which not?
3. look for what changed           deploys, config/flag changes, traffic shape, dependencies, infra events
4. form a hypothesis               "requests from app v4.2 to /checkout time out on payments since 14:05"
5. test it with data               dashboards, traces, logs filtered by the hypothesis; compare good vs bad
6. mitigate first                  rollback, disable flag, shift traffic, scale — restore service before root-causing
7. find the root cause             5 whys / causal analysis on the preserved evidence
8. prevent recurrence              fix + tests + alert/runbook improvements (blameless post-mortem)
Compare good with bad: the fastest way to localize a problem is to split traffic by attributes (version, region, instance, customer, endpoint, payload size) and find the dimension where errors concentrate. High-cardinality, structured telemetry (devops-cloud/observability/) is what makes that possible.
3The Tools and What They Answer
| Question | Tool |
|---|---|
| is something wrong, how bad, since when? | metrics / SLO dashboards, deploy markers |
| which requests? which hop is slow/failing? | distributed traces (system-design/system-design/06-distributed_tracing) |
| what exactly happened in this request? | logs filtered by trace ID |
| which code is hot / stuck? | continuous profiling, thread dumps, async stack traces |
| what is the system doing right now? | live queries: pg_stat_activity, queue depths, connection pools, kubectl get events |
| network-level issues? | curl -w timings, dig, tcpdump/Wireshark, mtr (networking-web/fundamentals/11-latency_and_troubleshooting) |
| can I reproduce it? | replaying recorded traffic in staging, fault injection, load tests |
4Common Culprits (Check These Early)
- A recent change — deploy, config, feature flag, dependency upgrade, infra change. (A large share of incidents.)
- Timeouts and retries interacting (
06-…,07-…) — amplification, metastable failures. - Resource exhaustion — connection pools, file descriptors, memory, thread pools, disk, rate-limit quotas.
- Data-dependent bugs — one tenant's huge payload, one malformed record (poison message), unicode/timezones.
- Clock and ordering — skew between hosts, events out of order, TTLs and token expiry.
- Caching — stale or poisoned entries, cache stampedes.
- Partial deploys / version skew — old and new versions talking with incompatible schemas.
- DNS and certificates — expired certs, stale DNS caches.
5Distributed-System Bug Patterns
- Heisenbugs — disappear when observed (timing). Use always-on structured telemetry rather than ad-hoc debug logging.
- Split brain — two nodes both think they're leader (check fencing tokens, quorum).
- Lost updates — concurrent writers (
02-race_conditions/), check versions/CAS. - Duplicate processing — at-least-once delivery without idempotency.
- Thundering herds — synchronized retries, cache expiry, cron jobs at :00.
- Cascading failures — one slow dependency saturating callers (
07-resilience_and_reliability_patterns/).
6Making Systems Debuggable (Before You Need It)
- Structured logs with trace IDs, service version, region, tenant (
devops-cloud/observability/01-logging). - RED metrics per endpoint and per dependency; saturation metrics for every pool and queue.
- Tracing with sampling that keeps errors and slow requests.
- Deploy/flag events as annotations on dashboards.
- Runbooks per alert; dashboards that start from the user symptom.
- Debug endpoints (protected): build info, config (redacted), pool stats, feature flags.
- The ability to turn up logging for one tenant/request at runtime without a deploy.
Under the HoodWhy Clocks Make Causality Hard▾
Timestamps from different machines aren't directly comparable: NTP keeps clocks within milliseconds normally, but skew of tens or hundreds of ms happens, and a VM pause or leap-second smear can move clocks unexpectedly. Sorting a merged log by wall-clock time can therefore show an effect before its cause. Distributed systems establish causal order differently: Lamport timestamps (a counter incremented on every event and set to max(local, received) + 1 on message receipt) give an order consistent with causality; vector clocks detect concurrency; and tracing's parent/child span links encode causality explicitly, which is why traces are more trustworthy than timestamp-sorted logs when reconstructing "what caused what". When comparing timings across hosts, prefer durations measured on one host (span durations) to differences between two hosts' timestamps.
⚠️ Common Pitfalls
- Root-causing before mitigating while users are still affected.
- Changing several things at once — you won't know what fixed it.
- Trusting timestamp order across hosts.
- Debugging with averages — the problem lives in a slice (one region, one version, one tenant).
- No preserved evidence — restarting everything destroys the state you needed (take dumps/snapshots first if safe).
- Blame-oriented post-mortems — people hide information; fix systems, not people.
📋 Quick Reference
symptom → scope (split by attributes) → what changed? → hypothesis → test with data → mitigate → root cause → prevent
metrics: is it broken? · traces: where? · logs (by trace id): what exactly? · profiles/dumps: why is it stuck/hot?
check early: recent changes · timeouts/retries · exhaustion · data-dependent · clocks · caches · version skew · DNS/certs
🧠 Key takeaways
- Distributed bugs: partial failure, concurrency, network delays and clock skew; symptoms appear far from causes.
- Method: scope the impact → build a timeline (what changed?) → hypothesize → verify with data.
- Traces answer where, logs what exactly, metrics how much/when; check deploys, config, certificates, DNS, limits first.
- Clocks disagree: use trace context and logical clocks (Lamport/vector) for causal order.
🎤 Interview Q&A
Q1How do you debug an issue that spans multiple services?core▾
Start from the symptom (alert, error, slow endpoint), use distributed tracing to find which service/span is failing or slow, pivot to that service's logs via the trace/correlation ID, check its metrics and recent deploys/config changes, then form and test hypotheses.
- What should every log line include? Timestamp, service, level, trace/correlation ID and structured context.
Q2Why are distributed systems hard to debug?core▾
Partial failures, nondeterministic timing, clock differences between machines, asynchronous flows through queues, retries hiding errors, and issues that only appear under production load or data.
- Why can't you trust timestamps across hosts? Clock skew; use trace causality or logical clocks for ordering.
Q3What's the first thing you check during an incident?core▾
What changed: recent deploys, config or feature-flag changes, traffic patterns, dependency status, infrastructure events. Most incidents are caused by changes; rolling back is often the fastest mitigation.
- Then? Scope the impact (which users, endpoints, regions) using dashboards.
Q4How do you debug intermittent failures?senior▾
Collect more data around occurrences (sampling errors at 100%), correlate with time, host, version, region or input data, look for resource limits (pools, file descriptors), retries and timeouts interacting, and try to reproduce with load or fault injection.
- Common culprits? Timeouts set shorter than tail latency, connection pool exhaustion, DNS caching, race conditions.
Q5What tooling makes distributed debugging easier?core▾
Structured logging with central search (ELK, Loki), distributed tracing (OpenTelemetry + Jaeger/Tempo), metrics dashboards (Prometheus/Grafana), error tracking (Sentry), and runbooks linking these together.
- What is exemplars? Links from metric data points to example traces.
🛠️ Practice exercises
Each exercise is a file in this topic folder. Code exercises are self-checking: run them and make the checks pass.
✅ Check yourself
Answer the questions — feedback is instant.