Memory and Resource Management
Memory, file handles, sockets and connections are all finite. Watch an unbounded cache leak toward an out-of-memory crash, fix it with bounds, release resources deterministically, and stream instead of buffering.
🎯 What you'll learn
- Resources beyond memory
- Garbage collection basics and what it can't fix
- Deterministic cleanup (finally, using, pools)
- Bounding, streaming and finding leaks
📚 Before you start
1Resources Are Finite — Not Just Memory
A process holds many limited resources: memory, file descriptors (files, sockets), database connections, threads, timers, locks, temporary disk, GPU memory, external rate-limit quota. Leaking any of them degrades the process slowly and then fails it suddenly ("EMFILE: too many open files", "connection pool exhausted", OOM kill). Managing resources means: acquire late, release early, always release, and bound everything.
2Garbage-Collected Memory, Briefly
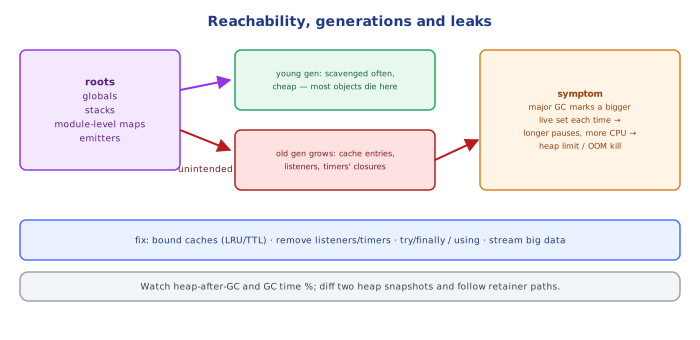
In JavaScript, Java, C#, Go and Python, the runtime frees objects that are no longer reachable from roots (globals, stacks, registers). Most use generational collection: most objects die young, so a small young generation is collected often and cheaply; survivors are promoted to an old generation collected less often (V8: Scavenger + Mark-Sweep-Compact; JVM G1/ZGC; .NET gen 0/1/2; Go's concurrent mark-sweep without generations).
So a "memory leak" in a GC language means objects that stay reachable unintentionally:
| Leak | Example |
|---|---|
| unbounded caches/maps | const cache = new Map() keyed by request ID, never evicted |
| listeners never removed | emitter.on("data", handler) per request on a long-lived emitter |
| closures capturing big objects | a timer callback capturing a 50 MB buffer |
| timers/intervals not cleared | setInterval per connection |
| global arrays used as logs/queues | debugLog.push(...) forever |
| detached DOM nodes (frontend) | removed elements still referenced from JS |
3Deterministic Cleanup
GC frees memory eventually; it does not promptly close sockets, files or DB connections. Use language constructs that guarantee release:
// TypeScript 5.2+ / Node 22+: explicit resource management
await using conn = await pool.connect();      // conn[Symbol.asyncDispose]() runs at scope exit, even on throw
await conn.query("…");

// classic form
const conn = await pool.connect();
try { await conn.query("…"); }
finally { conn.release(); }
Equivalents: C# using/await using (IDisposable), Java try-with-resources (AutoCloseable), Python with (languages/python/12-context_managers), Go defer. Never rely on finalizers for resource release.
4Bound Everything
| Resource | Bound with |
|---|---|
| in-memory caches | max size + eviction (LRU) + TTL (databases/caching/04-caching_strategies) |
| queues/buffers | max length + backpressure or load shedding (distributed-systems/fundamentals/05-backpressure) |
| concurrency | semaphores / worker pools / p-limit |
| connection pools | max size (and DB-side limits: pool × instances ≤ max_connections) |
| request bodies / uploads | size limits (backend/frameworks/15-file_uploads) |
| per-request work | timeouts, pagination, max result sizes |
| container memory | cgroup limits + runtime heap limits aligned (--max-old-space-size ≈ 75% of the container limit) |
5Streaming Instead of Buffering
Loading a 2 GB file or a million DB rows into memory to transform them is the most common self-inflicted OOM. Stream them: fs.createReadStream → transform → write, cursors/for await over query results, pagination for APIs. Memory then stays proportional to the chunk size, not the data size (backend/frameworks/15-file_uploads Under the Hood).
6Finding Leaks
- Observe the trend: heap used after GC (not raw RSS) climbing steadily across hours/requests = leak; sawtooth that returns to baseline = normal.
- Reproduce under load in a test environment.
- Heap snapshots (Chrome DevTools /
node --inspect,v8.writeHeapSnapshot(),jmap/Eclipse MAT,dotnet-gcdump): take one, generate load, take another, compare — look at what grew and follow retainer paths to the root holding it. - Allocation sampling / profiling to find hot allocation sites.
- For handles:
lsof -p <pid>,process._getActiveHandles()(Node), pool metrics (in-use, idle, waiting).
Under the HoodV8's Heap and Why Old-Space Growth Hurts▾
V8 splits the heap into a young generation (two small semi-spaces, a few MB) and an old generation. New objects are bump-allocated in the young space; when it fills, the Scavenger copies live objects to the other semi-space (and promotes objects that survived twice to old space) — cost proportional to live objects, so short-lived garbage is nearly free. The old generation is collected by Mark-Sweep-Compact: mark all reachable objects from roots (incrementally and concurrently on helper threads), sweep dead ones, and occasionally compact to reduce fragmentation. A leak keeps promoting objects into old space; each major GC then has to mark an ever-larger live set, so pauses lengthen and CPU spent in GC rises until the heap hits --max-old-space-size and the process aborts with "JavaScript heap out of memory" — or the container's cgroup limit kills it first if the two limits aren't aligned. That's why "GC time %" and "heap after GC" are the leading indicators, long before the crash.
⚠️ Common Pitfalls
- Unbounded maps/arrays as caches or queues.
- Event listeners and intervals never removed.
- Relying on GC to close sockets/files/connections.
- Buffering whole files/result sets instead of streaming.
- Heap limit larger than the container limit — OOM-killed without a heap dump.
- Looking at RSS only — fragmentation and native buffers confuse it; watch heap after GC.
📋 Quick Reference
leak in GC languages = unintended reachability (caches, listeners, closures, timers, globals)
always release: try/finally · using / await using · with · defer
bound: caches (LRU+TTL), queues, concurrency, pools, bodies, timeouts
stream large data; align heap limit with container limit
diagnose: heap-after-GC trend → snapshots diff → retainer paths; lsof / pool metrics for handles
🧠 Key takeaways
- Everything is finite: memory, file handles, sockets, connections, threads, timers.
- GC frees unreachable objects; reachable but unneeded data (unbounded maps, listeners, closures) still leaks.
- Release deterministically (try/finally, using, pools); bound caches, queues and concurrency.
- Stream large data; find leaks with heap snapshots and growth trends.
🎤 Interview Q&A
Q1How does garbage collection work at a high level?core▾
The runtime finds objects no longer reachable from roots (stack, statics, registers) and frees them. Most GCs (.NET, JVM) are generational: new objects are collected often and cheaply because most die young; survivors are promoted to older generations collected less frequently.
- What's a GC pause? Time application threads are stopped during parts of a collection.
Q2How can you have a memory leak in a garbage-collected language?core▾
Objects stay reachable unintentionally: event handlers never unsubscribed, growing static caches/maps, closures capturing large objects, timers holding references, or unbounded in-memory queues.
- How do you find it? Heap snapshots compared over time (dotMemory, Chrome DevTools, VisualVM), looking at retainers.
Q3How do you manage non-memory resources?core▾
Release deterministically: using/IDisposable (C#), try-with-resources (Java), context managers (with) in Python, try/finally. Pool expensive resources like database connections and HTTP clients.
- Why reuse HttpClient in .NET? Creating one per request exhausts sockets (TIME_WAIT); use IHttpClientFactory.
Q4How do you reduce GC pressure in hot paths?senior▾
Allocate less: reuse buffers (ArrayPool), use structs/Span<T> for short-lived data, avoid boxing and LINQ allocations in tight loops, stream instead of loading whole files, and pool objects where measured to help.
- What's the Large Object Heap? In .NET, objects ≥ 85 KB go there; collected only with gen 2, so avoid frequent large allocations.
Q5What causes connection pool exhaustion and how do you fix it?core▾
Connections not returned (missing dispose), long-running queries or transactions, sync-over-async, or more concurrent requests than pool size. Fix leaks, add timeouts, size pools sensibly relative to the database's limits, and use poolers like PgBouncer.
- Symptom? Requests timing out waiting for a connection while the DB itself looks idle.
🛠️ Practice exercises
Each exercise is a file in this topic folder. Code exercises are self-checking: run them and make the checks pass.
✅ Check yourself
Answer the questions — feedback is instant.